Intro
Wastewater monitoring for SARS-CoV-2 has shown to be an early indicator of community spike in COVID-19 cases. Data on increased detection of SARS-CoV-2 concentrations in the wastewater can meaningfully inform response testing and other community transmission mitigation efforts.
Sewage grid modeling and automatic composite samplers
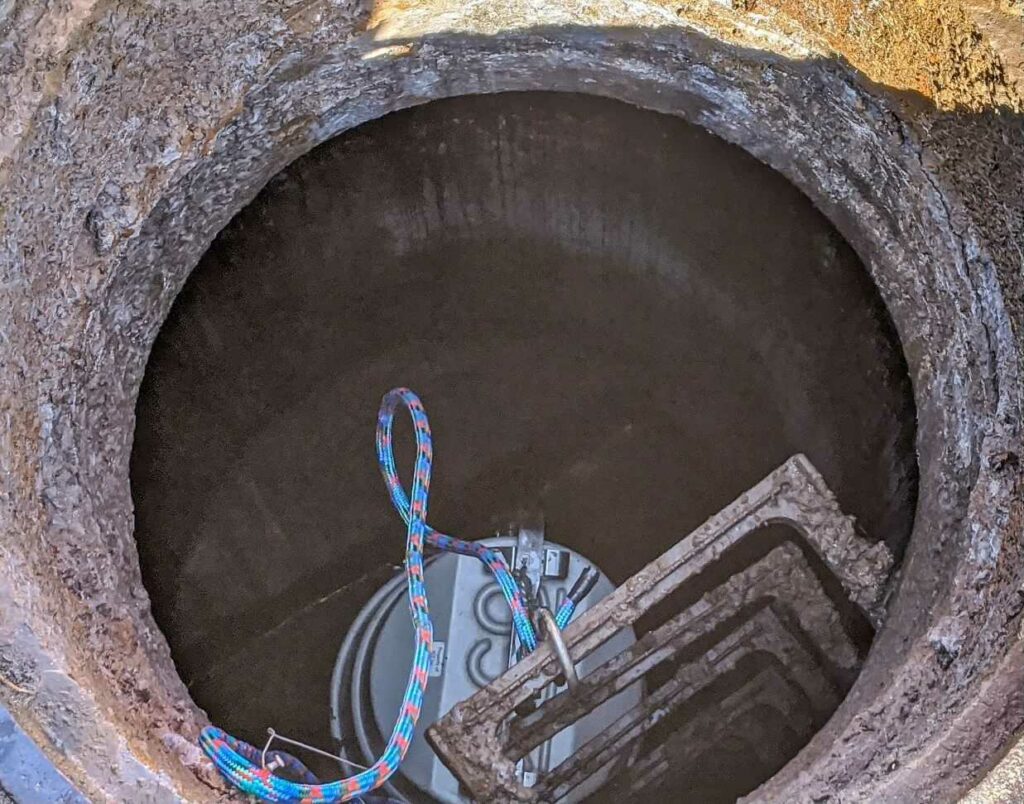
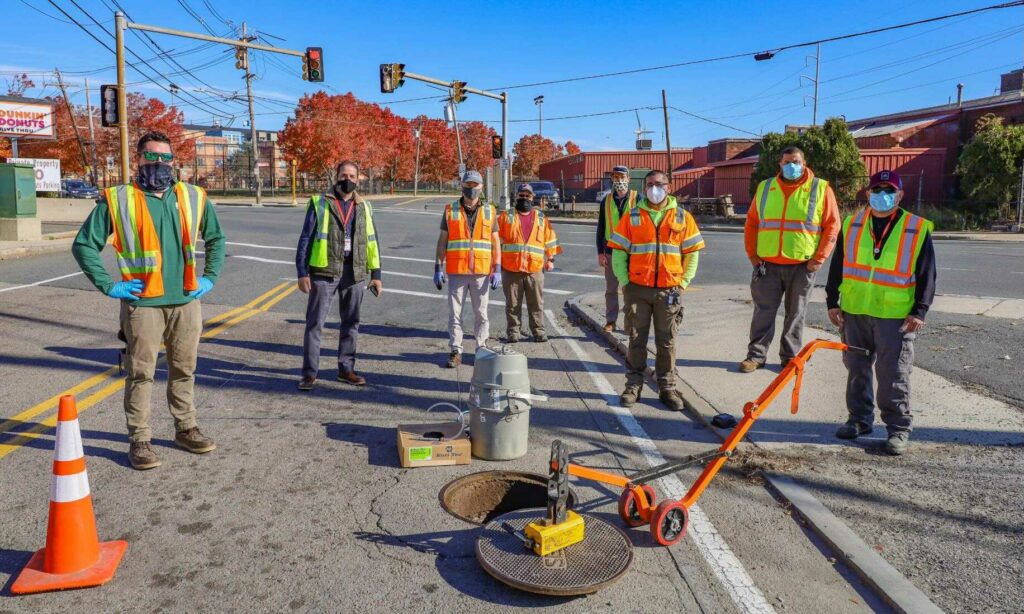
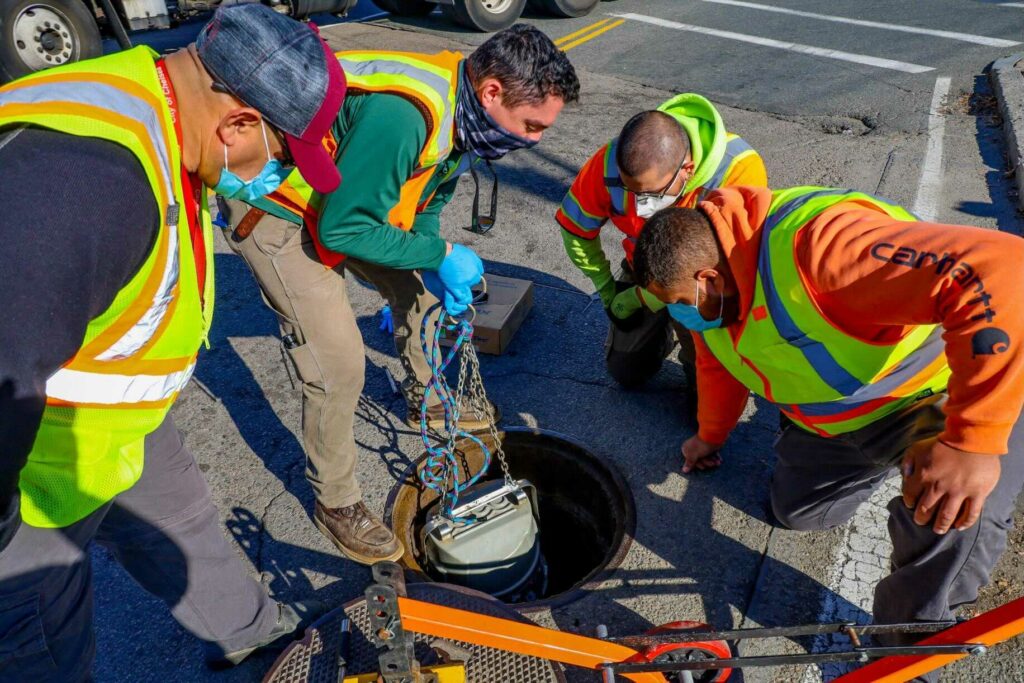
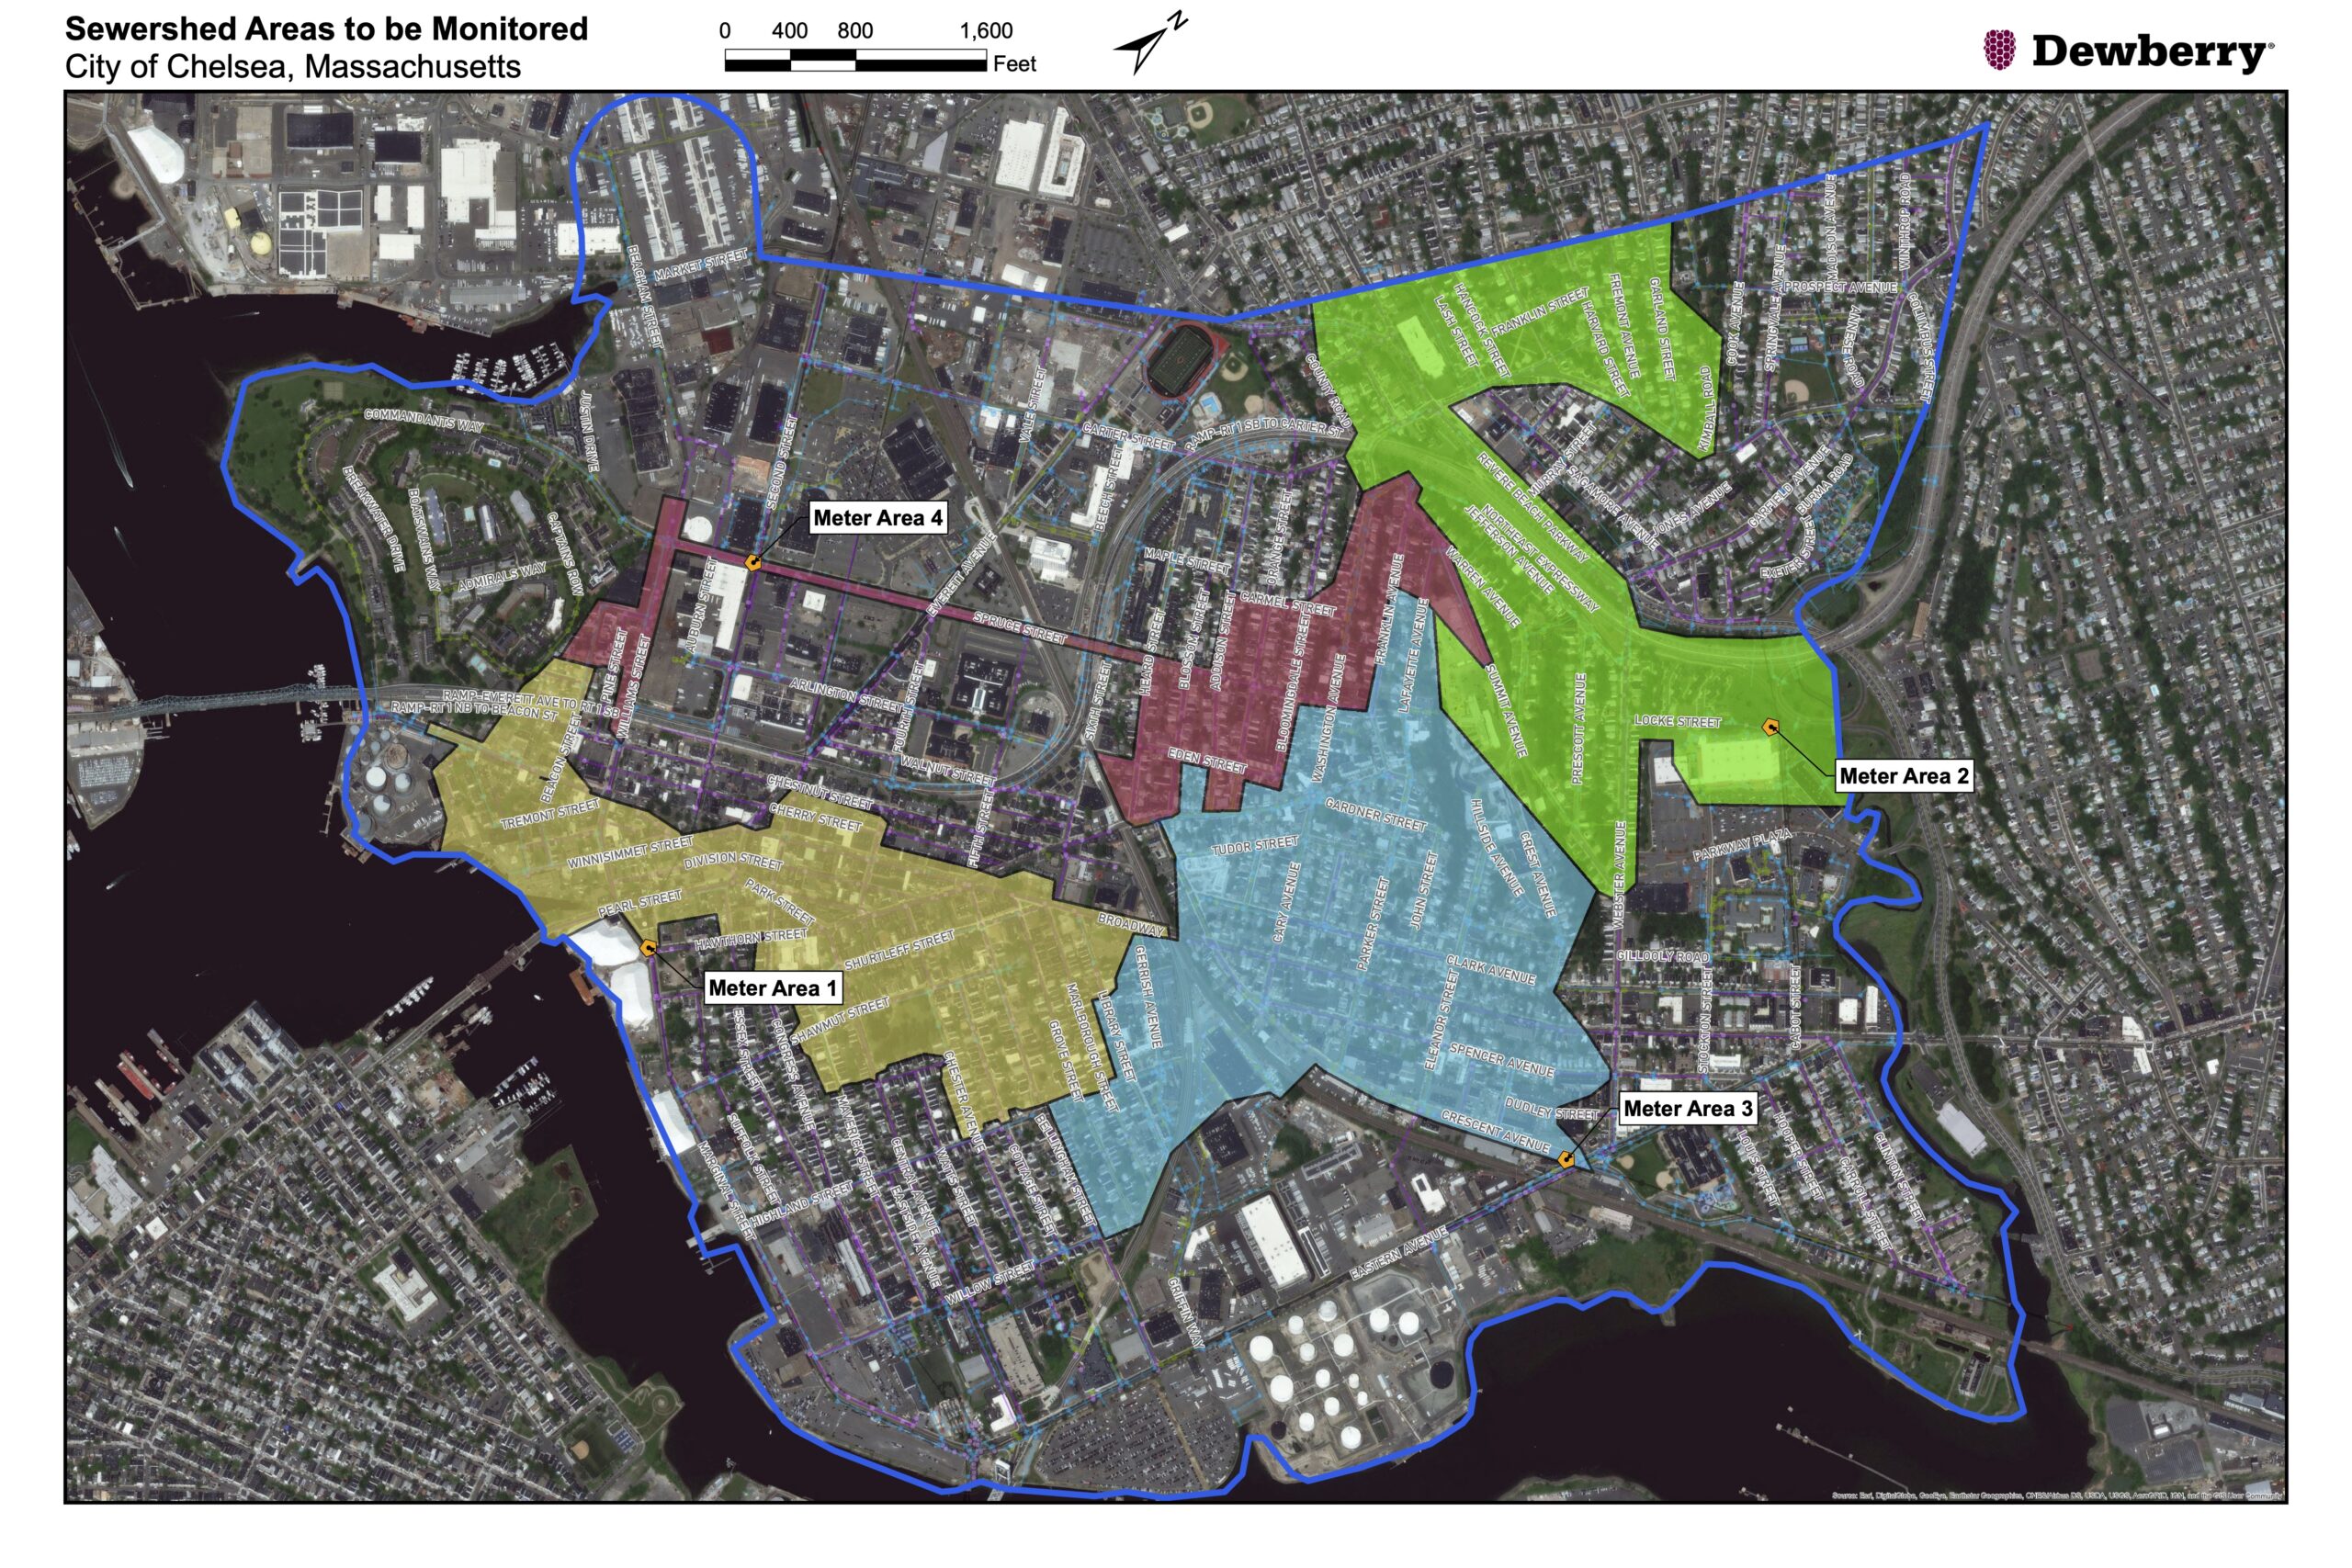
We worked with Dewberry and the Chelsea City Department of Public Works (DPW) to model Chelsea’s sewage grid system. This analysis has generated four distinct sewage watersheds. We worked with Dewberry and DPW to identify sampling sites for each of the four sewage watersheds. Automatic composite wastewater samplers are devices that can collect wastewater samples automatically over a predefined length of time. These samplers were procured and installed at the sampling sites. They will be permanent fixtures for the city and used for a wide variety of public health purposes.
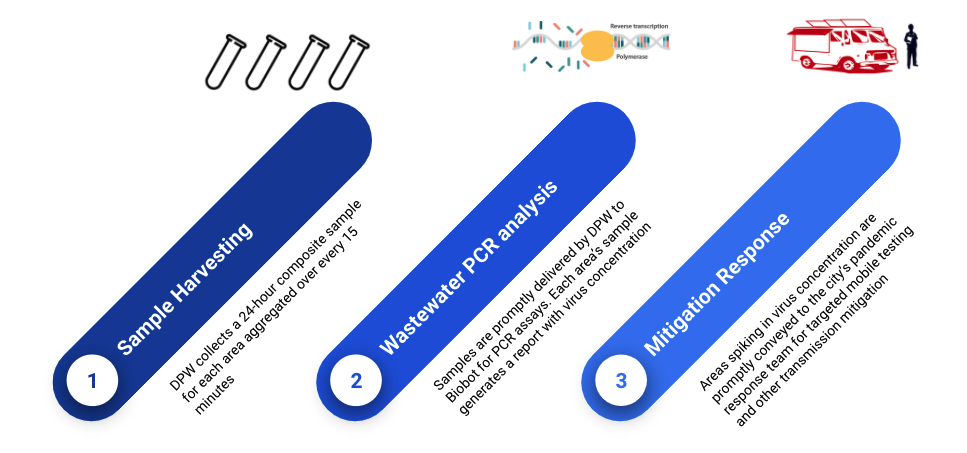
Distinct and separate composite samples are collected weekly for each of the four sewage watersheds. Each week, a 24-hour composite wastewater sample aggregated every 15 minutes is automatically harvested by DPW and delivered to the Cambridge laboratories of Biobot.
Wastewater PCR Analysis
We have worked with the Metropolitan Area Planning Council, DPW, and Biobot to estimate the population represented in each of the sewage watersheds. Biobot uses the population estimates and analyzes the wastewater samples by conducting PCR assays. Each sewage grid’s wastewater sample analysis produces a report delivered to us promptly. Each area’s wastewater report contains a normalized concentration of SARS-CoV-2, which allows us to see trends in how much COVID-19 infection is prevalent in each area.
Response Testing and Transmission Mitigation
We communicate these trend analyses promptly to the pandemic response team of the city. We have found a 1-week advance indication between a spike in wastewater SARS-CoV-2 concentration and a reported rise in the number of positive COVID-19 cases within each area. We’ve also seen a 2-week advance indication between a drastic decrease in the virus’s wastewater concentration and a corresponding fall in the number of positive cases in each area.
Process
Normalized SARS-CoV-2 virus concentration and their 3-day moving averages for each sewage watershed area. We also include the normalized virus concentration for Northern and Southern Massachusetts. Virus concentrations in Chelsea are consistently higher compared to the rest of the state.